14 C
At 

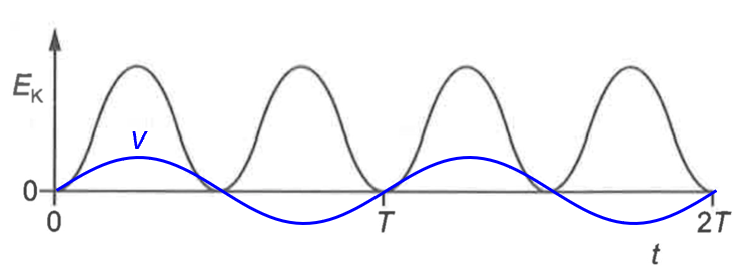
Each oscillation contains two complete energy cycles. So the EK graph must show two complete cycles during one T. (See below how the velocity-time graph is overlayed onto the EK graph)
14 C
At
Each oscillation contains two complete energy cycles. So the EK graph must show two complete cycles during one T. (See below how the velocity-time graph is overlayed onto the EK graph)

One thought on “24P1Q14”