We have had so much fun with two slits. Naturally, we want to add another slit to make it 3-slit interference, right?
Firstly, let me emphasize that we are talking about 3 slits which are equally spaced out. In other words, consecutive slits have the same slit separation d. Hence waves from consecutive slits arrive at (each point on) the screen with the same path difference 

This has the important implication that when the 3 light rays arrive at a point on the screen, ray B will lag ray A by the same phase difference as ray C lags ray B.
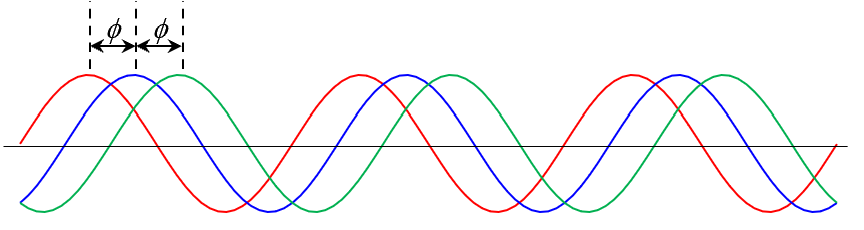
Let’s consider what happens when 
Ray C will arrive exactly one cycle after ray B, which arrives exactly one cycle after ray A. So all 3 sinusoidal waves arrive in phase at P, superposing constructively to form a resultant wave of amplitude 3A (assuming the amplitude of each wave is A).
Let’s now consider what happens when 
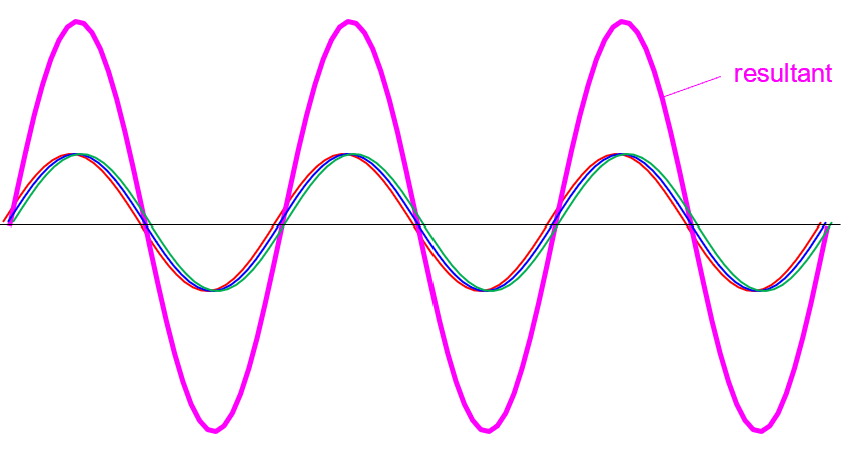
Ray C will arrive one-third of a cycle after ray B, which arrives one-third of a cycle after ray A. It is like we have 3 sinusoidal waves spaced apart with 120° between (A and B), (B and C) and (C and A). Do you realize that these 3 sinusoids are going to sum up to zero? The 3 rays interfere destructively to cancel one another out!
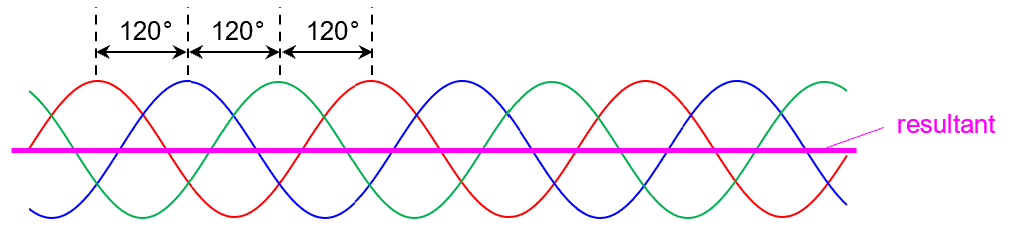
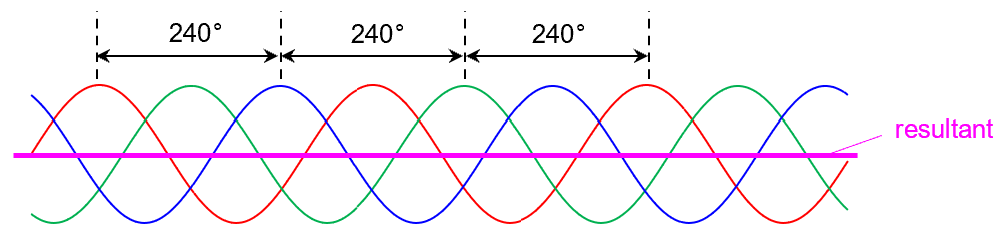
Amazingly, D.I. also occurs among these 3 waves when 
With some thought, we can deduce other values of
C.I. when  | D.I. when |
| 0 |  , ,  |
| λ |  , ,  |
| 2λ |  , ,  |
Alright. I guess we are now confident enough to add even more slits!
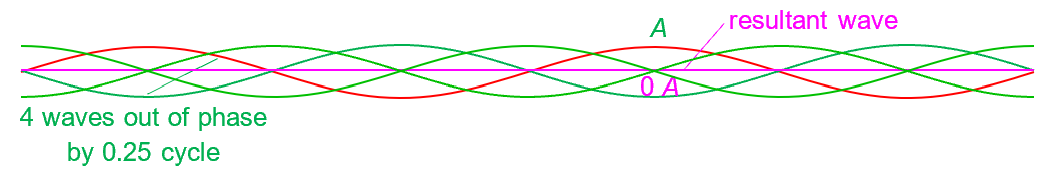
If we have 4 slits (and 4 rays), the first D.I. occurs when the 4 waves are spaced apart by 

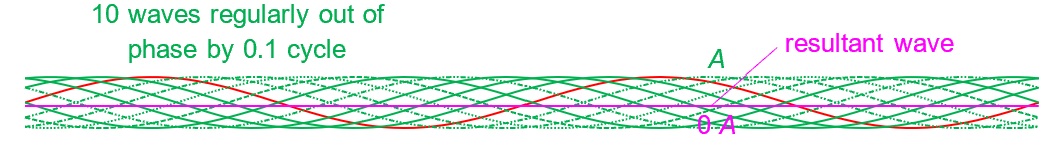
If we have 10 slits (and 10 rays), the first D.I. occurs when the 10 waves are spaced apart by 

By extension, we can deduce that for N slits:
Bright fringes are formed at angles θ where 
Dark fringes are formed at angles θ where 


The graphs below show how the interference pattern’s intensity profile changes as we add more and more slits (while maintaining the same slit separation d).

Note that as N increases the number of bright fringes do not change. Neither do their positions. However, they do become brighter, since they have amplitude NA and intensity 


Note also that as N increases, the number of dark fringes increases. In fact, there are 
–
